Setting Up Ghost Trends
Sometimes you may want to keep track of two charts at the same time. For this example, I’ll demonstrate the weekly chart and the daily chart.
To set this up, we will be loading two iterations of the Polytrends algo onto our charts.
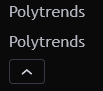
The first iteration will create the weekly ghost trend effect.
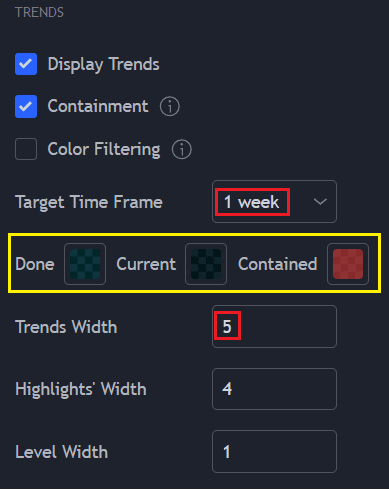
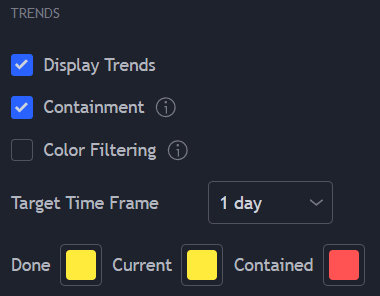
Your settings should resemble these; however you may wish to adjust them to fit your preferences:
- Target Time Frame: ‘1 Week’
- Adjust the opacity (15-20%) and desired color of your polytrends “done, current, contained”
- Set Trends Width to ‘5’
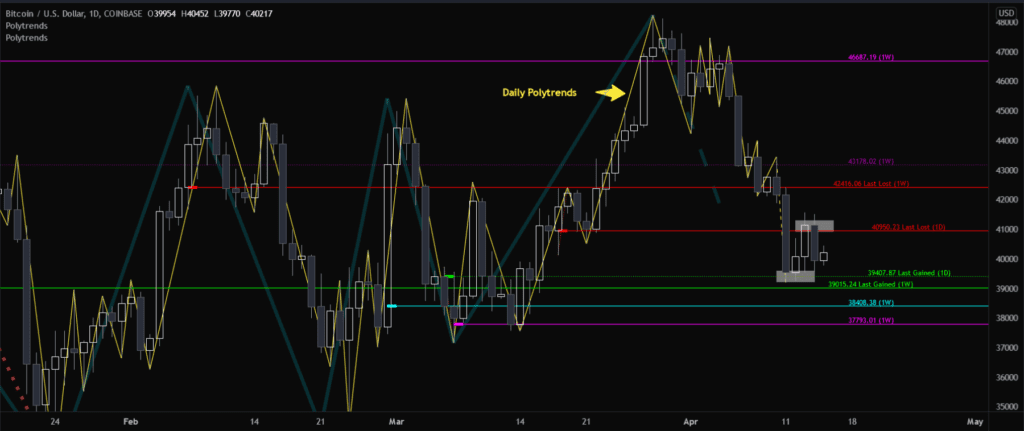
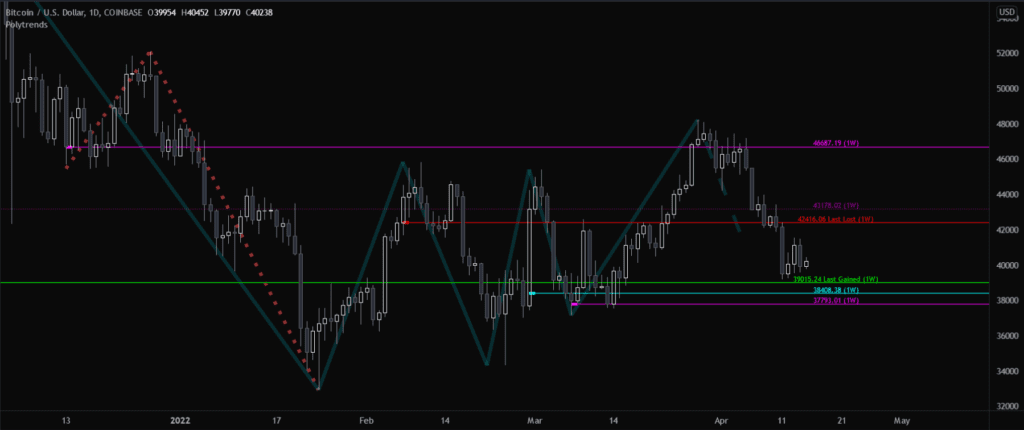
You may want to see weekly corresponding levels from the weekly chart, displayed and overlapped onto your daily chart. To do this, simply enable levels, and adjust the relevance factor to your personal preference. Depending on your settings, it will look something like this:
Some of you may not be interested in seeing the weekly levels, but would like to see the weekly polytrend being referenced. Just simply disable the weekly Polytrend levels iteration.
The next step involves the second Polytrends indicator iteration. We will configure it for the daily chart:
- Set your ‘Target Time Frame’ to either 1 Day or Chart
- Configure your amount of levels you wish to see on the daily chart. (This example has been set to 0 levels and only displays ‘last gained/lost’)
- Enable or disable ‘Display Trends’ will either show/hide your daily polytrends (as seen below in yellow)
As you can see below, you are now able to understand the levels highlighted in white. Two short-term trades or profit targets could have been initiated from either of those levels.
You can now also visualize the larger weekly (poly)trends of relevance, the weekly levels of significance, as well as the daily trends/levels, on a single chart.