What’s a Tested Level and Why Do They Matter?
A level of support or resistance is simply just a price level within a market where trading occurs resulting in price inflections.
As you already know, Polytrends attempts to plot the most significant levels on the chart.
As you notice all of the levels being plotted, you will start to notice that some are tested and others are not, or this may be an entirely new concept to you as many traders are often completely unaware of this.
What is a tested level? Simply put, a candlestick that visits the price of a specified level.
Identifying Tested Levels
I should point out again, due to the limiting factors of the current Tradingview coding language, plotting tested levels won’t always be accurate. Sometimes a level will actually be tested and not plotted as such. For this reason, we have decided to label the ‘display tested’ setting as experimental. Not to worry though, I will show you how you can check them for yourself.
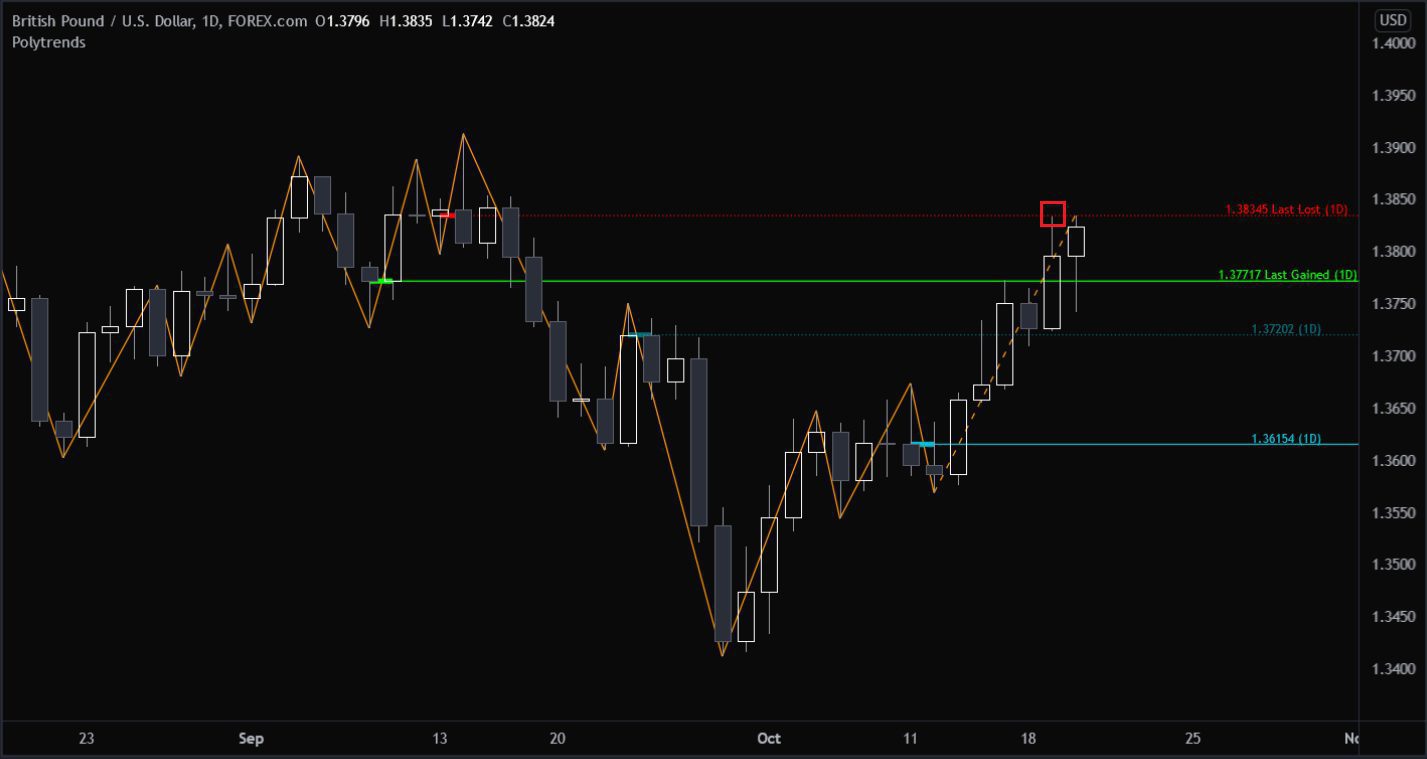
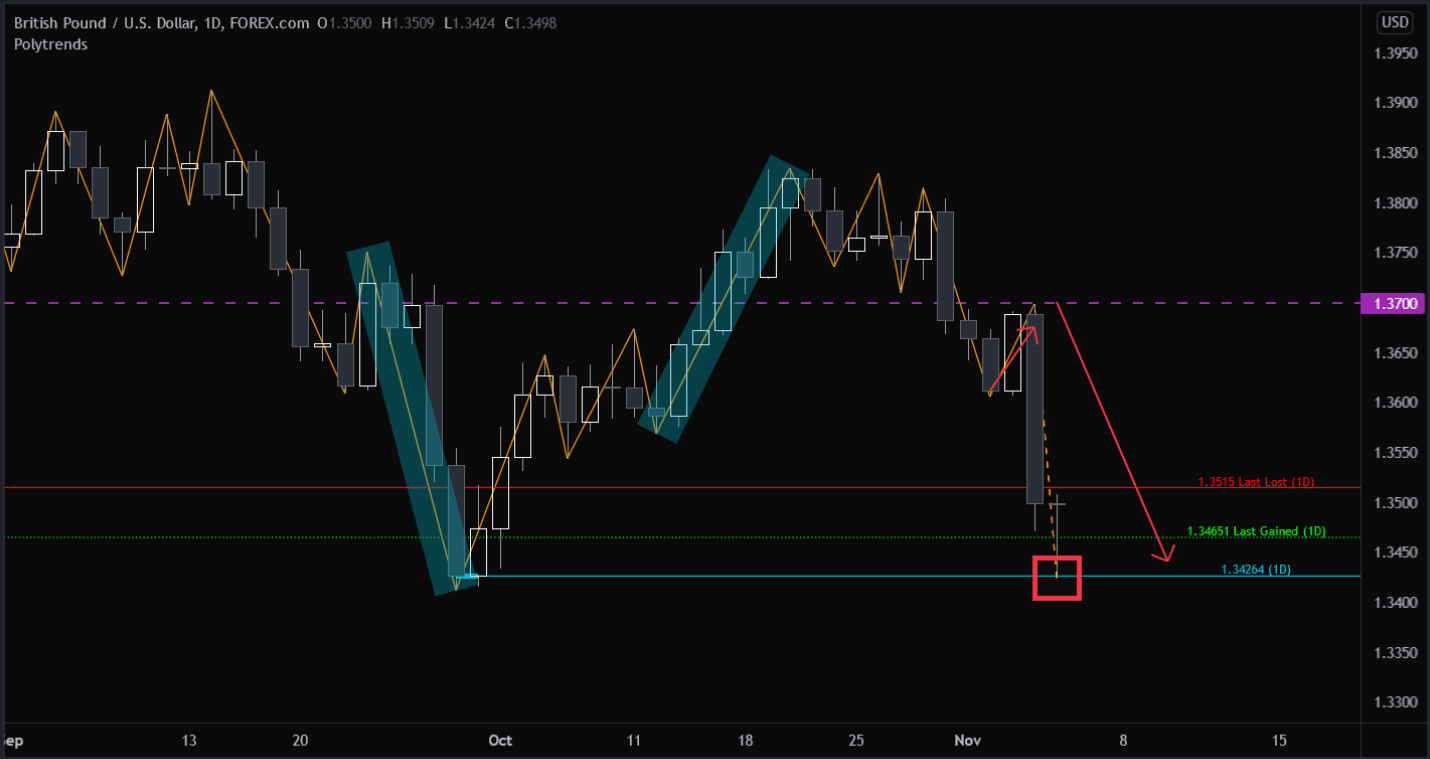
Upon the test of a level and after the candle closes, Polytrends will re-plot the tested level with a dotted line. In the picture below, I drew a red box at the level where you can see a test occurred.
Where the Magic Happens
This is the part where you realize how powerful Polytrends actually is, and once you see it, you will never unsee it.
In the picture below, you should be able to see each test, highlighted in red and denoted by a red box. Notice the levels that Polytrends also plotted, which just so happens to be the same place from where price pivoted? Do you now see why this is so valuable?
I haven’t pointed this out to you, and I’ll review this idea in the strategies section later, but did you notice that on the ‘first test’ of each untested level, price tends to repel away from the level, acting as an inflection point?
I hope you can see how powerful this information can be for you, and I hope you can see the level of accuracy here. If you can’t, then I suggest you study your charts a bit more.
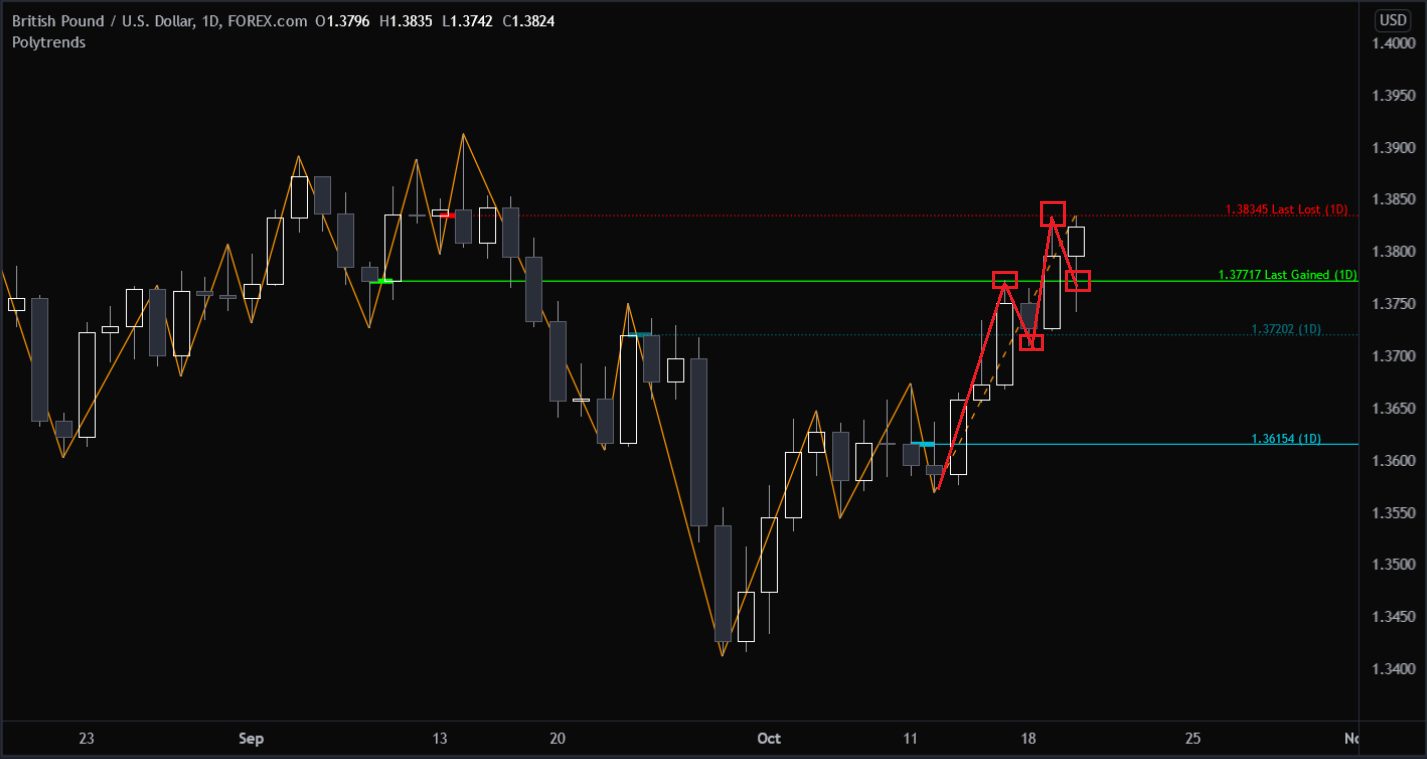
Remember this chart and the bottom blue level at: 1.36154(D). We will come back to it shortly.
Untested Level Theory
I do not know the exact reason why this happens, and I suspect no really does, but I can offer my theory:
Markets move because people are buying and selling. When they move, sometimes they continue in a prolonged fashion, due to liquidity constraints. A lack of liquidity (trading happening at that moment) or an enormous amount of instantaneous liquidity will cause prices to move.
When a level is untested, my theory suggests that orders may be resting at an ‘untested’ level and traders may be waiting to enter. Very little liquidity will have been removed from the order books at untested levels. Once the price reaches the untested level, you’ll often see a repulsion away from the level.
What happens when a level is actually tested already?
Piggybacking on the liquidity theory, if a level has been tested, much less liquidity would be resting in the area. For this reason, the price is much more likely to continue progressing through the level of interest, and onward to the nearest untested.
There are some exceptions to this rule that are a bit outside the depth of discussion here, but it’s worth noting that some products tend to hold or “respect” a tested level more often than others.
Do you see what happened here? Remember how I said every level in the above charts got tested, creating inflection points? And I just explained how only untested levels offer the best trading opportunities because of the liquidity theory…
So if all the levels leading up to the red box were tested, where might we expect the price to gravitate towards? The nearest untested level.
Remember how I told you to take note of the level at 1.36154(D)?
Take a look below at where the price went…
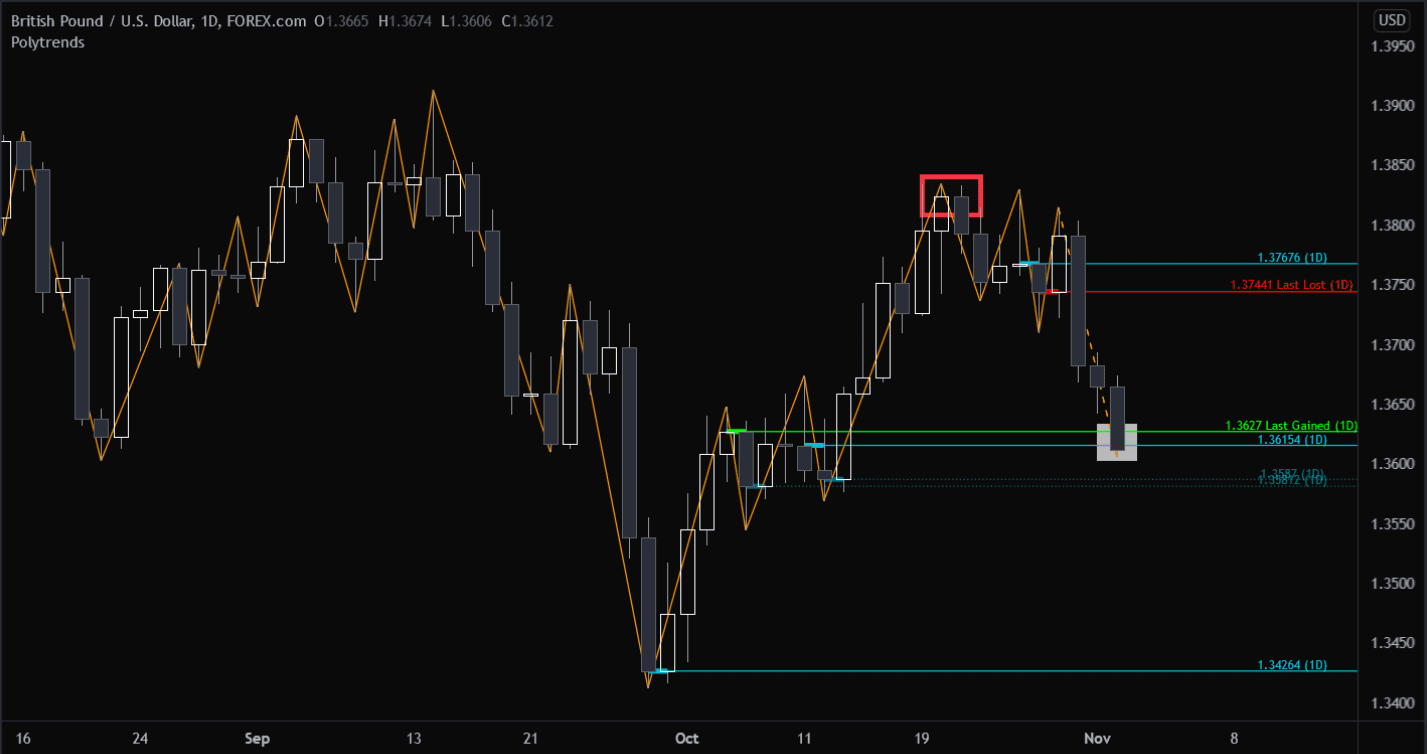
This will be the last example of tests because, in order to see the next move, you must have some mastery of trends. We know price trended lower, down into an untested level of support, therefore we might expect it to bounce higher. When the price is moving, I always ask myself:
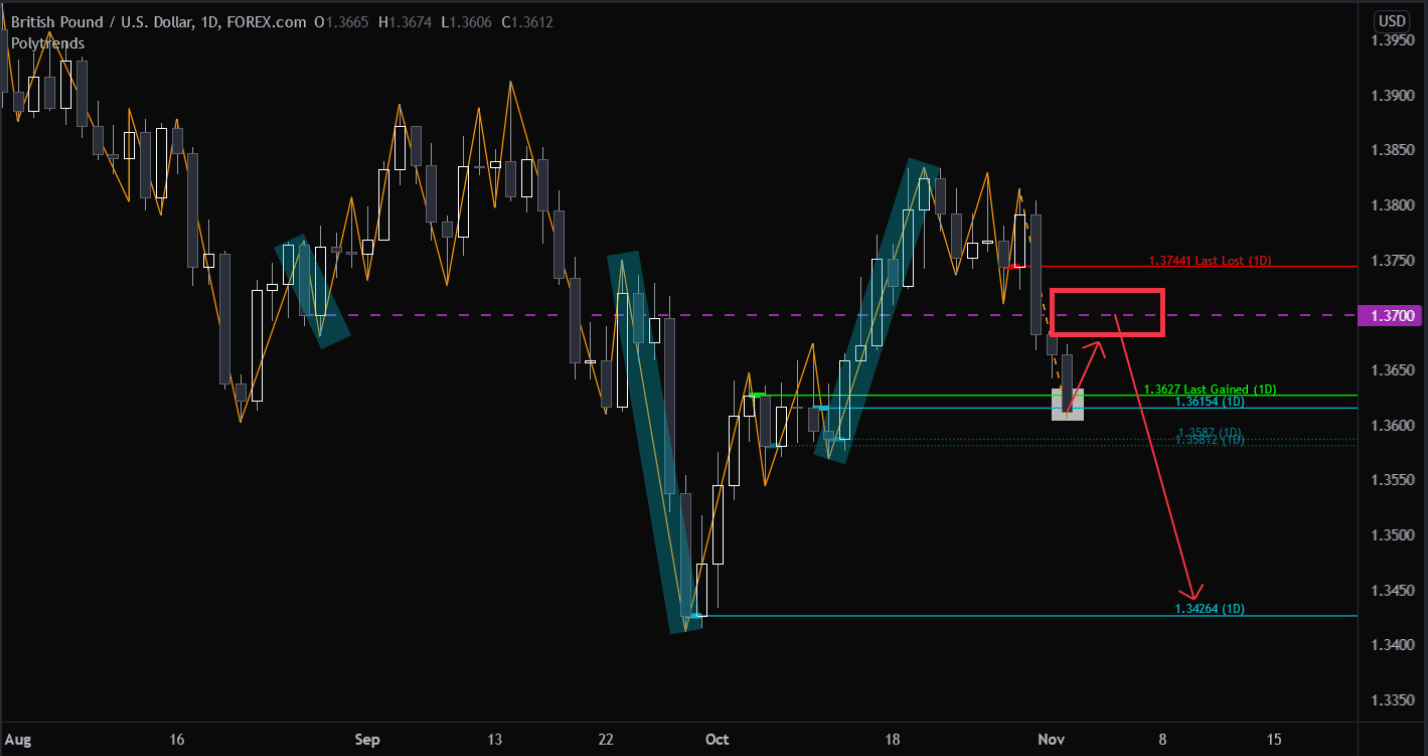
Are there any trends to my immediate left or further left of the chart, which may provide an untested level that could hinder the progression of the price? If the answer is yes, I would make note of it.
Because I know this is far more advanced than most people have progressed in their trading knowledge, I highlighted those areas in blue for you, and the nearest relevant level is drawn in purple.
So we expect a possible bounce from our untested level in the white box at 1.36154(D) (mentioned three times now), but where would we expect a bounce to? If the price gets above the ‘last gained’ at 1.3627, we’d expect 1.3700 to be our next untested level and potential target.
You Don’t Yet Realize what you have at your fingertips…
Or maybe now you do.
This is something that has taken me over a decade to learn and master. Don’t be frustrated if you’re just now learning.
I encourage you to go back and look at each chart here and pay attention to the levels Polytrends outlined. Where did the price go?