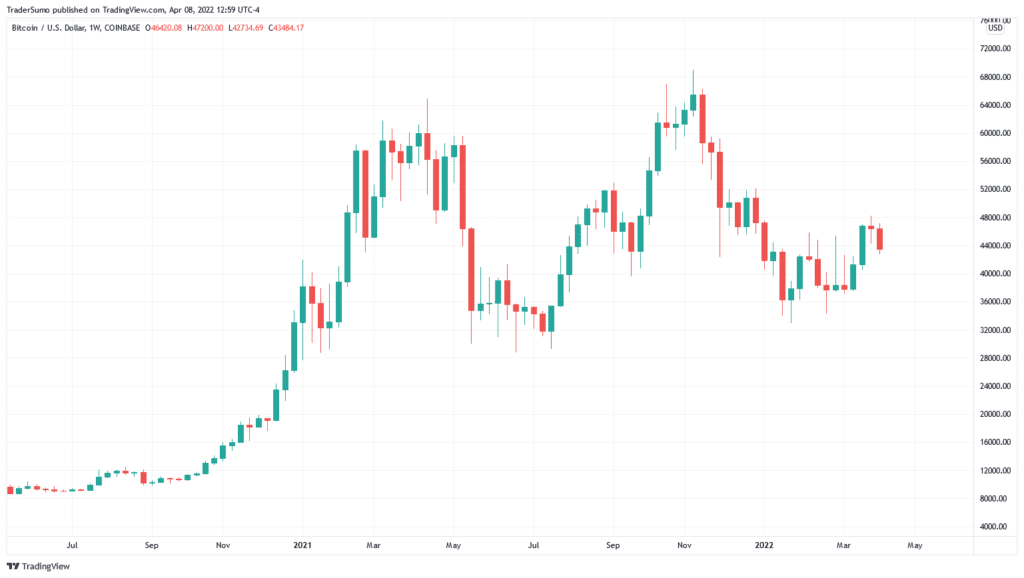
I’m new, what is a chart?
A chart is a graphical representation that typically consists of two axis: time and price.
Traders use charts to track price movements for analysis purposes.
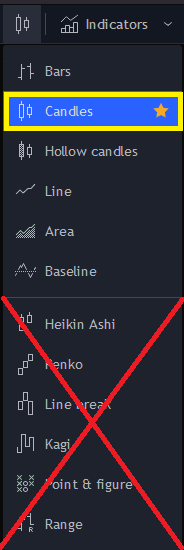
Which chart should I use?
Polytrends was specifically designed for “candlestick” chart usage. Using any other charting type will limit or hinder Polytrends Algo accuracy.