How to Configure Polytrends
Once you’ve loaded Polytrends onto your charts, it’s time to adjust settings to fit your trading style/needs.
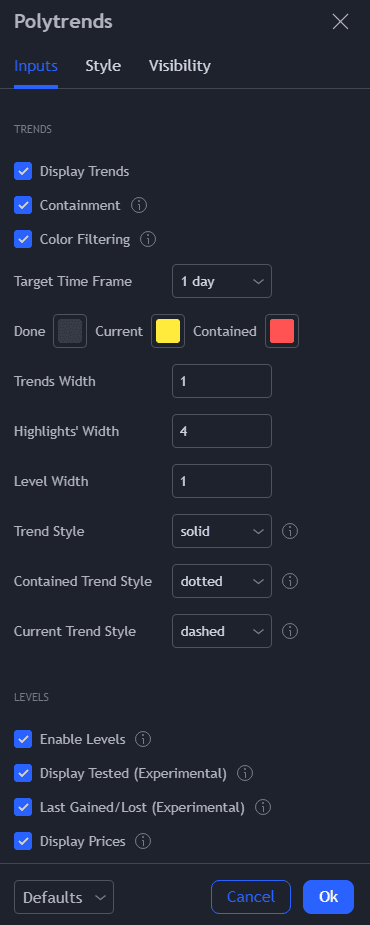
Polytrends has a number of settings that you may wish to configure.
Access the Polytrends Settings
At the top left of your screen, locate and click the “cogwheel” to the right of the Polytrends indicator.
![]()
You will now have the ability to change the settings to configure your chart.
Configuration Toggle Options
Use these options to change the look, feel, and processing of the Polytrends Algo.
Display Trends
When checked, this toggle will display the trends drawn by Polytrends.
Containment
When checked, this toggle will display containment trends, default drawn in red.
Color Filtering
When checked, this toggle will ignore Polytrend levels that are calculated using candles of similar color. Leave this unchecked if you would like to see more trends/levels.
Target Time Frame
This toggle allows you to target and plot Polytrends on a specific timeframe. You must be looking at a chart of the same timeframe or of a lower timeframe setting as the target timeframe.
Example: You may want to view a daily chart while using a weekly Polytrends plot. To do this, you would need to set your target timeframe to 1 Week, and then switch your Tradingview chart to Daily.
Done, Current, Contained Color Boxes
This function allows you to recolor the corresponding trends.
Trends Width
This allows you to change the width of trends drawn on your chart.
Highlight’s Width
The highlight’s width indicates from where a level was derived. Changing the width will change the size of the highlight box.
Level Width
This allows you to change the width of the horizontal Polytrends levels drawn on your chart.
Trend, Contained Trend, Current Trend Styling
These settings allow you to change the look of your different trends
Enable Levels
This allows you to toggle levels on and off.
Display Tested
This will attempt to mark a level as tested or untested. This function may not always work as intended due to some Tradingview data limitations that are beyond our control.
Last Gained/Lost
This allows you to toggle levels on and off levels that Polytrends thinks were last gained/lost. These will be default colored in Red or Green.
Display Prices
This toggle will display the price of a level on the right of the chart.
Display Timeframe
This toggle will display from what timeframe a level was derived on the right of the chart.
Price Offset
This value will attempt to move the price text along the horizontal level axis.
Price Size
This value will change the sizing of your price display.
Untested, Tested
This will allow you to change the look of tested/untested levels.
Max Levels
This will set the maximum value of levels Polytrends will attempt to track at any given time. Lowering this value will sometimes help in reducing indicator loading errors.
Upper, Lower, All-Time High, Last Gained, Last Lost
This allows you to change the color of specifically targeted level types.
Above
This value will plot the number of levels above the current price.
Below
This value will plot the number of levels below the current price.
Relevance Factor
This value will change how far Polytrends looks back and to the left of the chart. The higher the value, the further left Polytrends will look back.
Error Margin %
This value will change how accurate Polytrends must be to deem a level tested or untested.